Abstract

Introduction
Myelodysplastic syndrome (MDS) patients (pts) with TP53 gene mutation (MT) have poor outcome. Recent studies suggested higher response rates to hypomethylating agents (HMA) among TP53 MT MDS pts. Those studies were limited by small number of TP53 MT. We compared the outcomes in a large cohort of TP53 MT MDS patients to those with wild type TP53 (WT) treated with HMA.
Methods
We identified MDS patients who underwent next generation sequencing (NGS) for TP53 MT who received hypomethylating agents in our MDS database. NGS included a panel of up to 54 genes with VAF threshold of 5% and minimum depth of coverage was 500X. We compared baseline characteristics between pts with TP53 MT and WT; chi square was used for categorical variables and t-test for continuous variables. Patients with low or intermediate-1 risk International prognostic scoring system (IPSS) were categorized as lower risk MDS (LR-MDS) and those with intermediate-2 or high risk IPSS as higher risk MDS (HR-MDS). The best response rate to HMA treatment was reported utilizing international working group criteria (IWG 2006); overall response was reported as HI+ which included complete response (CR), marrow CR, partial response and hematological improvement. Kaplan Meier estimates were used for overall survival (OS) where median OS was calculated from time of diagnosis, log rank test was used for comparison and cox regression analysis for multivariable analysis.
Results
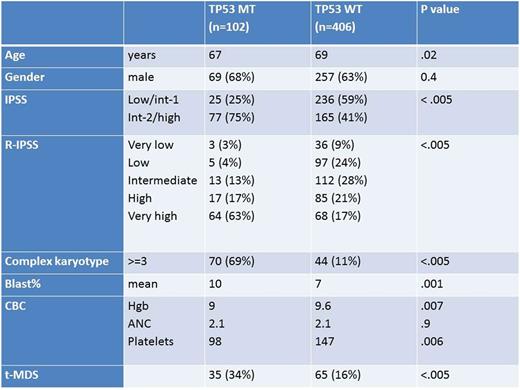
We identified 508 pts who underwent testing for TP53 MT and were treated with azacitidine or decitabine, 102 pts had TP53 MT. Table-1 summarizes baseline characteristics between the two groups. Among TP53 MT pts, 97 (95%) received azacitidine and 5 (5%) pts had decitabine as the first line HMA compared to 374(92%) treated with azacitidine and 32 (8%) with decitabine in TP53 WT pts as the first HMA (p= .3).
Best response to HMA (HI+) was 41% (CR 18%) and 32% (CR 9%) among pts with TP53 MT and WT, respectively (p =.06). Among pts with LR-MDS the best response rates were 32% vs 25% (p=0.4) and in pts with HR-MDS the best response rates were 44% and 41% respectively in TP53 MT and WT (p=0.7). Median OS was 14 mo for TP53 MT MDS pts compared to 41 mo for TP53 WT pts (p<.005). The median OS was 45 and 65 mo. respectively in LR-MDS TP 53 MT and WT pts (p= 0.3). Among HR-MDS pts the median OS was 12 and 21 mo, respectively (p< .005).The median OS was 15 mo and 41 mo among pts with TP53 MT and WT who achieved CR, respectively (p <.005).
For pts who underwent allogeneic hematopoietic stem cell transplant (AHSCT) the median OS was 16 mo for TP53 MT and 74 mo for TP53 WT (p=.008).
After adjusting for age, R-IPSS, complex karyotype TP53 MT was independently associated with worse overall survival in HMA treated patients, HR 1.4 (p = .048).
Conclusions
We observed a trend for higher response rates among MDS pts with TP53 MT treated with HMA compared to TP53 WT. The median OS was inferior among TP53 MT MDS patients. The benefit of AHSCT among TP53 MT pts is not clear. The value of TP53 allele burden reduction and clearance with treatment and prior to AHSCT should be further investigated.
Komrokji: Novartis: Honoraria, Speakers Bureau; Celgene: Honoraria. Sallman: Celgene: Research Funding. Padron: Incyte: Honoraria, Research Funding. Sweet: Ariad: Consultancy, Speakers Bureau; Otsuka: Consultancy; Novartis Pharmaceuticals: Consultancy, Speakers Bureau; Karyopharm: Consultancy, Research Funding; Pfizer: Consultancy; Incyte: Research Funding. Lancet: Boehringer Ingelheim: Consultancy; Jazz Pharmaceuticals: Consultancy; Janssen: Consultancy; Erytech: Consultancy; Celgene: Consultancy; BioSight: Consultancy; Pfizer: Other: Institutional research funding, Research Funding; Bio-Path Holdings: Consultancy; Novartis: Consultancy.
Author notes
Asterisk with author names denotes non-ASH members.

This icon denotes a clinically relevant abstract


This feature is available to Subscribers Only
Sign In or Create an Account Close Modal